Counting atoms with moles

As you may have learned in high school chemistry, a mole is 6.022 x 10²³ of something (usually something really tiny, like atoms). This seemingly arbitrary value is also known as Avogadro’s number. Why is it named after him, and how did that value come to be chosen?

Avogradro’s full name was Lorenzo Romano Amedeo Carlo Avogadro di Quaregna e di Cerret, and he had nothing to do with defining the value for a mole. Instead, he came up with the ideal gas law, which says that two samples of gas that occupy the same volume (with the same temperature and pressure) also contain the same number of molecules. It is most often encountered as pV = nRT. In 1909, 53 years after Avogadro died, Jean Perrin proposed naming the value of a mole after him.

Beyond Avogadro, why use 6.022 x 10²³ as the basis for a mole? The history of this decision is an interesting illustration of what happens when a common value must be chosen for convenience, but there is no physical reason to prefer one over another (a similar situation arises for planetary coordinates; latitude has a well defined start point due to the axis of rotation, but longitude has to be given a start point arbitrarily). Originally, and quite logically, chemists used hydrogen (the simplest element, with only one proton) as a basis for computing atomic weights. They set H=1 and computed values for everything else relative to hydrogen. Later others proposed using oxygen as a standard (O=16), since oxygen is so prevalent and combines with so many things, and after decades of debate, in 1961 they finally settled on using carbon (C=12) as the standard. And so the value for a mole was born: the number of atoms in 12 grams of carbon-12 (isotopes matter!). (How do you count them though? See here.)

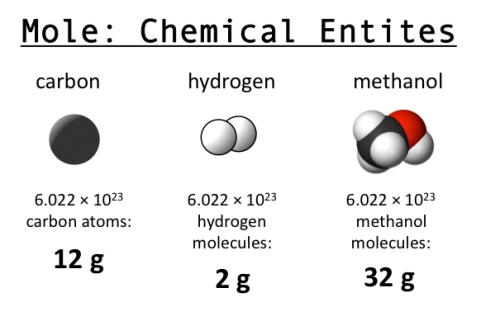
Why do we care? The mole is useful because of stoichiometry, one of my favorite words ever. If you know that you need 2 hydrogen atoms for every 1 oxygen atom to make water, then you know you need 2 moles of H for every 1 mole of O. A 2:1 ratio based on weight or volume won’t work, but you can convert moles into grams with knowledge about the atomic weight of each. This tells you exactly how much to mix to get the result you want, without wasting anything. Very efficient! (Image from Clear Science.)

Even though it came from just 12 grams of carbon, a mole is a really, really big number. No, really. I love these analogies (from CDLI’s Chemistry 2202 course) that help us understand how big:

How big is a mole?

  • one mole of peas is enough to cover Earth and 250 more planets the same size as Earth one metre deep in green peas
  • a stack of one mole of pennies is tall enough to reach Proxima Centauri (the second closest star to Earth) and back again 7448 times
  • a mole of marbles spread over the Earth would cover it to a depth of 80 km
  • if you own a mole of dollars and you spend a billion dollars a day, then you could spend that amount per day for over a trillion years before you run out of money. (Earth has only been around for 4.5 billion years i.e. that’s 0.45% of a trillion years!)

For more molar fun, I highly recommend this mole lesson/activity. And six months from now, you can celebrate Mole Day: October 23, from 6:02 a.m. to 6:02 p.m.

Cracking the optometry code

Have you ever wondered what a diopter is? After my most recent trip to the optometrist, I decided to find out what an eyeglass prescription means.

Wikipedia, as usual, is a great place to start. At a high level, the “spherical” correction number indicates how much isotropic correction is needed — magnification that applies equally in all directions. The “cylindrical” correction applies to astigmatisms, which require magnification preferentially in one direction to fine-tune the spherical correction. “Axis” specifies the orientation of that cylindrical correction.

The units in which the spherical and cylindrical corrections are specified are called diopters. A diopter has a physical meaning; it is the reciprocal of the focal length in meters. So a spherical correction of -0.50 corresponds to a lens with a focal length of 2 m.

I collected my prescriptions since 1998, when I first got glasses. Now I can track my visual degradation graphically (except for an elusive 2006 prescription, which I cannot find — argh!):

Apparently my distance vision isn’t terrible (something like 20/50), but my astigmatism is what causes me blurring trouble, and it keeps getting worse. Next up: a regression analysis in which I forecast the date on which I’ll be legally blind!

Wikipedia also includes an interesting discussion of presbyopia, the gradual decline in ocular lens flexibility. This is what permits your eye to focus over a wide range of distances. Children generally can accommodate a range of more than 10 diopters, while those older than 50 can only accommodate 2. Check out this plot:

Wikipedia claims that kids can focus on something only 10 cm (~4 inches) from their eyes. Can you? Try it! (I can’t, darn!) This calculator purports to determine how much reading-glass (near-vision) correction you would need, as a function of your age; unfortunately, it only works if you’re at least 37.

As an interesting etymological note, the root “presby-” in presbyopia means “old” or “elder” (i.e., presbyopia = elder-eye), and is the same root in “priest” (“presbyter”) and “presbyterian.”

Control a robotic telescope

The other day, I came across Observing With NASA, a site that lets anyone submit requests to a network of robotic telescopes. You pick a target and some simple observational settings, then submit your job — and the next day, you get an email with your results.

I had to try this out.

On March 17, I submitted a request to observe the moon, which seemed a good target since it would be nearly full. The next day, I received the excellent news that my image, that’s right, MY IMAGE OF THE MOON, was ready for accessing. Is it not beautiful?

You can also request images of the planets, stars, nebulae, and galaxies. I’m full of praise for this endeavor — what better way to let the public get involved with astronomy than by letting them select which observations to make? The website is easy to use and the results are rewarding. (You can download a FITS file with your data if you’d like to do more analysis, for which tools are also provided.)

Want to take your own picture with the Robotic Telescope Network? Click here!

Kepler’s challenges

The Kepler mission has already reported a slew of fascinating discoveries, including new planets and new kinds of planetary systems, and there is every expectation that in the final two years of observations it will continue to reveal more and more planetary treasures. However, no mission or instrument functions exactly as expected, and Kepler has had its share of challenges in collecting and processing its data. “Overview of the Kepler Science Processing Pipeline” by Jenkins et al. (2010) provides a fascinating behind-the-scenes look at some of these obstacles and their solutions.

Kepler consists of a one-meter telescope that has been staring at the same patch of sky for two years. Its goal is to measure the brightness of 156,000 stars every 29.4 minutes (“long-cadence” observations) and a smaller set of 512 stars ever 58.85 seconds (“short-cadence”). Each star generates a light curve of its brightness as a function of time. Exoplanets are detected as slight drops in the brightness while the planet transits in front of the star. For this light curve to be usable for detecting planets, Kepler needs two things: 1) a stable pointing so that the stars don’t bounce around or smear, and 2) a stable sensitivity so that any perceived brightening is due to an actual change in the stars.

During the first few months of observations, the first requirement was challenged. Kepler uses a set of “guide stars” to help fine-tune its pointing, and unfortunately it turned out that one of the guide stars selected in advance was an eclipsing binary. Whenever it would eclipse (so one star hid the other one), its brightness dropped and Kepler lost lock on it. As a result, the pointing was slightly off for 8 hours every 1.7 days (!). Kepler only downlinks its data once a month, so it took a few months to notice and correct this. The eclipsing binary star was eliminated from the guide star list and this problem has gone away.

The telescope is very sensitive to thermal conditions, any changes in which can wreak havoc with its focus. One of Kepler’s RWAs (reaction wheel assemblies, used to point the spacecraft, e.g., to pivot it towards Earth for data downlink and back to resume looking at the stars) has a heater that inadvertently modifies the telescope’s focus by about 1 micron every 3.2 hours. There’s no way to fix this, so it just has to be modeled and removed from the data in processing. Likewise, the spacecraft has experienced two “safing” events in which most of its systems shut down, which cools the entire assembly; each time when operations resumed, it took five days for the thermal effects to disappear from the data.

Perhaps most challenging is an artifact that manifests as “Moiré patterns caused by an unstable circuit with an operational amplifier oscillating at ~1.5 GHz.” Luckily, the actual impact on the data values is very small, generally only perturbing them by a single increment, but it is virtually impossible to adequately model and remove, so no doubt a source of at least minor frustration:

“Given that the Moiré pattern noise exhibits both high spatial
frequencies and high temporal frequencies, the prospect of reconstructing a high-fidelity model of the effects at the pixel level with an accuracy sufficient to correct the affected data appears unlikely. We are developing algorithms that identify when these Moiré patterns are present and mark the affected CCD regions as suspect on each affected LC.”

And finally, there was a curious overall brightening (termed “argabrightening”) observed in early phases of the mission. About 15 times per month, the background brightness of the entire field increased dramatically for a short time. The current hypothesis is that this was caused by remnant dust particles coming loose from Kepler and floating off, then reflecting sunlight back into the telescope. Detecting and removing affected observations was crucial for yielding consistent light curves. Fortunately, the rate of these events has decreased over time (Kepler might be running out of dust).

I look forward to more fascinating news from this great mission! And I hope they keep sharing the interesting challenges and lessons learned from operating a telescope from so very far away.

Why audio connectors are called “jacks”

Make: Electronics by Charles Platt is one of my current favorite books. I’m working my way through it, experiment by experiment, and learning tons about circuits, components, soldering, schematics, and more along the way. Recently I was working with switches and relays and learned an interesting bit of etymology.

Switchboard operatorsSwitches permit the controlled connection, or disconnection, of a circuit. We’re all familiar with light switches, doorbells, computer on/off switches, etc. Less familiar (now) is the telephone switchboard, for which an operator had to be able to selectively connect together pairs of the thousands of possibilities, as quickly as possible.

Charles E. Scribner, a man of great ingenuity, developed the “jack-knife switch” to make fast switching possible. This was a plug with a jackknife-like handle (hence the name) that could be inserted into a socket to activate the switch. Two such plugs at either ends of a cord allowed the connection of any two sockets, yielding an active telephone connection.

Although switchboards are no longer used today, the same jack-knife switch design was used to design audio connectors — which is why we refer to those plugs as “jacks”, even though no knife handle remains. I had never thought to wonder why they were called that!

« Newer entries · Older entries »