Inspiring geology at Arthur’s Seat

Edinburgh is where James Hutton delivered his landmark lectures claiming not only that the Earth was older than the then-accepted 6,000 years, but that it was “immeasurably old” given the tools available in that time (1785). (How he would have loved to have lived to the invention of radiometric dating!) Hutton was a great observer, taking careful note of the impact of regular daily erosional processes, and what they could do if extended out over aeons. He also traveled around much of Scotland and England examining interesting rock formations.

His careful observations inspired him to suggest the radical idea that molten rock from deep underground could force its way up through overlying, older sedimentary layers. (At the time, sedimentary rock was held to be the youngest rock type, as all existent rocks were believed to have precipitated out of a global ocean.) One of the formations that supported his claim is “Hutton’s Section”, lying at the base of Arthur’s Seat, just outside of Edinburgh. Naturally this was one of the highest priorities on my sights-to-see list!

Arthur’s Seat is the remnant of a volcano that erupted about 340 million years ago (see Arthur’s Seat’s formation history in sketch format). Edinburgh Castle is built on another volcanic remnant nearby. It’s a good climb up to the top of Arthur’s Seat (823 feet high), which affords an excellent view of the surrounding country. (It was gaspingly windy, although sunny, the day I climbed it, and people and dogs were stumbling around at the top, buffeted by the wind.) But one doesn’t see much geology from up on top of anything!

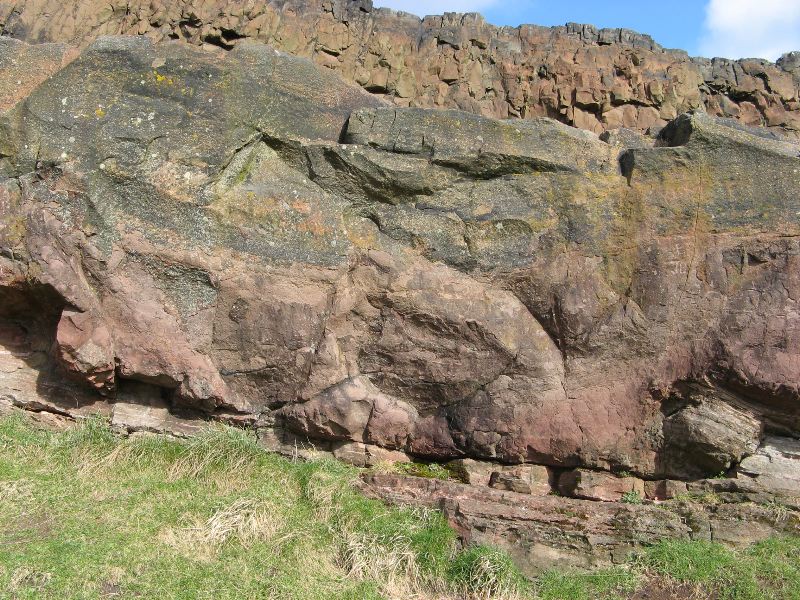
I found Hutton’s Section near the dip between Arthur’s Seat and the Salisbury Crags. The Crags are a volcanic sill, composed of lava that pushed its way out from the volcano’s main chamber to spread horizontally through the sedimentary layers. At Hutton’s Section, you can see a blob of volcanic rock intruding right into a sedimentary layer—from above. (See also the University of Edinburgh’s photo and description of the Section). I felt a moment of quiet, powerful awe as I stood in the same spot where Hutton had stood, seeing almost with his very eyes. (But would I have been able to interpret this evidence as ably as he did?) Later in the day, as I walked around to the north side of the Crags, I could see that there were several places where this same phenomenon occurs, not just at his Section. Repeatability lends credence!

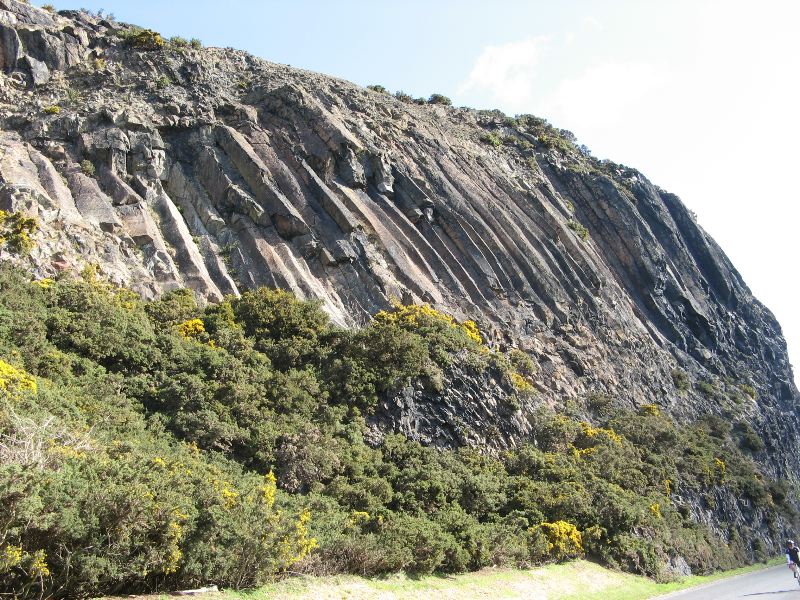
Another stunning geological sight at Arthur’s Seat is Samson’s Ribs, a sprawling cliff on the Seat’s southwest side composed of huge basaltic columns. Such geometric (hexagonal) construction always arrests the eye, since it seems so artificially precise and angular. Yet the crystal formation processes that lead to these structures are quite natural, and the size of the columns provides clues as to the rate at which the magma cooled and formed them.

If you ever get a chance, do stop and see these beautiful structures! And pick up some geocaches while you’re there: Weir’s Way: An Edinburgh Volcano, Arthur’s Seat Earthcache, Let’s Get Radical, and Samson’s Ribs Earthcache. For more information on James Hutton and his contributions to founding geology as a science, I recommend The Man Who Found Time, a book that served as a delightful in-country guide and provided all sorts of fascinating background on Hutton and his insights.

Volcanoes in my backyard

So again, on Sunday, I drove out to explore Amboy Crater (also see wikipedia’s article). It is a fairly recent cinder cone caused by volcanic activity out in the desert between 6000 and 500 (yes, only 500!) years ago. Once you get to the parking lot (about a 3-hour drive from here, not exactly my backyard), it’s a 2-hour round-trip hike to the crater, up to the rim (250 feet high), and back down and out. You get some spectacular views from the top of the desert and the huge lava field created by the cinder cone. I’d show you some views captured by me, except that I somehow left my camera at home (with my whole daypack, including lunch, extra water, batteries, etc.). I realized this just past Barstow (halfway to Amboy) and it wasn’t worth going back. Instead, I’ll just link to other people’s photos! (Photo at right is from Golden Gate Photo.)

Between Barstow and Amboy, I couldn’t help stopping to check out a few geocaches. One was inside Siberia Crater, an even smaller cinder cone (sadly, I didn’t actually find that one!). Another one was on a Route 66 loop off of I-40 (nice detour!) and another was at Amboy Crater itself. Boy, it was fun to sit on the rim and dig through an old ammo box full of plastic toys! There’s also a totally awesome cache just east of Amboy (the town), marked by a shoe tree. No, really: an old tree is hung about with hundreds of shoes.

The path out to Amboy Crater is marked with occasional educational plaques containing little facts about the desert. Two that stood out to me:

  • Desert lizards do “push-ups” to get warm (because they cannot regulate their own body temperature). But based on my previous knowledge (and some quick googling), this is totally wrong. Push-ups are a form of display, aggression, or communication, used in competition and in mating. If you’ve ever been the target of a push-up display, you’ll have noticed that the lizard points itself at you while doing it — it’s not a mindless set of calisthenics. Maybe the BLM needs to work with factcheck.org.
  • The tarantula bite is not deadly, but in self-defense it may flick hairs off its back, to which most animals (including humans) are allergic. This seems to actually be true! There’s even a word to describe these stinging hairs: urticating (check out some awesome photos of these hairs). They can cause anything from mild rashes up to anaphylactic shock.

But about the crater itself: there are lots of interesting volcanic features, including a lava field 24 square miles in extent; pressure ridges, where the lava has buckled upward; and stretches of pahoehoe (smoother) lava (although what I saw wasn’t as smooth or distinctive as that in Hawaii). There are also reputedly “squeeze-ups” of bulbous lava and “bowl-shaped depressions” where lava surfaces sank, but I didn’t see these. The view from the crater rim was excellent, with long shadows from the winter sun even at 3 p.m., gusty wind, and waving grass and brush colonizing the lumpy black lava field. (Photo by h.seng.)

The Great Southern California ShakeOut

I attended an excellent lecture this evening by Dr. Lucy Jones of the USGS titled, “The Science Behind the ShakeOut.” The Great Southern California ShakeOut is an exercise that will involve millions of southern California residents and responders in simulating a magnitude 7.8 earthquake at 10:00 a.m. on November 13, 2008. The scenario is pretty dramatic, but was deliberately chosen not to be the worst-case scenario; the goal is for the exercise to feel realistic enough to send a “this could really happen” message. Participants are encouraged to plan out how to get messages to friends and relatives in the aftermath of the quake (tip: text messages are more likely to get through than live phone calls), how to survive (stock up on water!), and to do a thorough check of what could fall/ignite/explode in the house.

The simulation videos are pretty fascinating (and disturbing). The earthquake originates south of L.A. but quickly propagates northward up the San Andreas, then gets “stuck” in the L.A. basin as the thickly piled sediment floor rattles around like jello for an estimated 55 seconds. (The 1994 Northridge earthquake lasted a grand total of 7 seconds.) Likely damages include:

  • Power lines crossing the San Andreas will be severed. This will trigger a cascade of failures that will take out the entire West Coast power grid. Interestingly, we will probably lose power 20-30 seconds before the quake reaches L.A.—a kind of “early warning” system.
  • Water crossing the fault will be disrupted. This is the most severe threat to post-quake survival, since the water distribution system is mostly concrete, quite old, and has little likelihood of being retrofitted to be more robust, and because humans don’t live very long without water. And we live in a desert…
  • On the other hand, our lack of water means that the chance of soil liquefaction (scary thought) is low.
  • Landslides will be rampant, causing damage and blocking roads.
  • Natural gas and gasoline pipelines crossing the fault will be severed. So will fiber optics and telecom lines. Just about all of our incoming lines and pipes of this sort cross the San Andreas somewhere and are therefore vulnerable.
  • Roads and rail lines crossing the fault will be broken. Fortunately, heavy investment in bridge retrofitting since the 1989 Loma Prieta earthquake has reduced the chance of bridge failure in the major highways.
  • 1 in 16 buildings will be “significantly damaged” (defined as incurring damage that would cost more than 10% of the replacement value to correct).
  • 133,000 houses will be burnt due to post-quake fires.
  • $213 billion in damages is expected.
  • There will be 53,000 injuries and 1,800 deaths. The latter apparently is quite a small number for a quake of this magnitude, due to increased building safety codes and other existing preparations.
  • Yes, this really isn’t the worst-case scenario. It assumes no Santa Ana winds (that would spread fires much further) and that the quake doesn’t propagate much further north than the San Fernando Valley. It also does not account for any damages that would occur due to the (probably large and several) aftershocks.

After the quake, we are likely to experience “rolling light-ups”, in contrast to rolling black-outs; each block will get a couple of hours of electricity per day, at rotating times, as the electricity comes back up to speed.

Overall, the talk was full of fascinating detail, and it’s clear that they’ve invested a lot of effort in defining the simulation scenario details. Many of the estimated numbers are the result of multiple independent teams making estimates and then pooling them together, to increase the reliability of the estimates. The likely outcome is sobering, and this isn’t a low-probability event; large quakes happen on the San Andreas about every 100-150 years. The last large one at the south end (where this scenario originates) was in 1685.

I signed up for the ShakeOut a few months ago, out of curiosity. Now I’m even more motivated to get around to preparing an actual earthquake kit and stocking up on water—and planning how I would get word out to friends and family to assure them of my survival.

Watch that Quake!

Today I discovered that the USGS provides KML feeds for Google Earth that will show you, in real-time, the latest earthquakes that have been detected. (Well, with a 5-minute delay.) This came in super handy at work just after the 5.4-magnitude earthquake hit Chino Hills and rolled through the ground under our office building. I’m on the fourth floor. At about 11:45 a.m., I noticed a sort of rocking feeling, and then the blinds started to smack into the windows, and then I headed for the interior doorframe. My grad student intern dove under her desk. Our administrative assistant joined me in the doorway and remarked, “It’s too late in the day for an earthquake! Usually they wake you up in the morning.” We all marveled and held our breaths until the shifting and rattling stopped. One co-worker was in the restroom when it happened and said that the sound of all the water sloshing around in the pipes was pretty “unusual.” Overall, though, nothing broken and no injuries. It was the strongest earthquake I’ve felt since moving here in late 2003.

Once things had stopped, everyone jumped on their computers to look up where it had happened and what the magnitude was. Chino Hills is about 30 miles away. I guess for people closer to the epicenter, things actually fell off shelves. But from a purely geeky perspective, it was lots of fun watching all of the aftershocks being reported in Google Earth. We couldn’t feel any of them (ranged from magnitude 1.2 to 3.4), but they just kept rolling in. The Earth is a mighty sleeping giant… and even a tiny twitch amid all that slumber serves as a firm reminder.

Sweet Spots for Life in our Galaxy

Yesterday, I attended the first day of the Astrobiology Science Conference, or AbSciCon. The day began with a great talk by Lord Martin Rees, who is the Astronomer Royal in England. He wrote a book called “Just Six Numbers” about six parameters of our solar system and Earth that have allowed for conditions conducive to the existence of life (and human beings). He was introduced by Paul Davies, who wrote “The Goldilocks Enigma”. Both books are now candidates for inclusion in my to-read list.

I next attended some talks about the galactic habitable zone. While I’ve read about the “habitable zone” inside our solar system (largely determined by the temperature range within which water exists as a liquid), this was the first time I’d encountered its galactic counterpart. In the galaxy, the constraints relevant for habitability (specifically, the creation of planets) involve the probability of a nearby, disruptive, supernova (so you don’t want to be too close to the galactic center, where stellar density is high) and the availability of metals for forming planets, which are more available where stellar density is high since they’re created by stars (so you don’t want to be too far away from the core). Our Sun is at 8.5 kiloparsecs from the galactic center, although it apparently wobbles in and out a bit, and there’s enough uncertainty in the measurement that it’s more like 7.5 to 8.8 kpc.

The discovery of exoplanets (planets outside our solar system, orbiting other stars) is, in my opinion, one of the foremost scientific discoveries of the past decade or so. It sounds like science fiction, but it’s real (we’re up to 287 exoplanets so far!). So far we’ve predominantly found only Jupiter-sized planets that are close to their host stars (and very, very hot), but most expect that this is because those are the planets that are easiest to detect. The hunt is on for Earth-sized planets that reside in their star’s habitability zone. In particular, a five-year study is beginning to collect 100,000 observations of Alpha Centauri B in hopes of detecting terrestrial planets. No planets have yet been detected in the complex (triple star!) Alpha Centauri system. However, in planet formation simulations, 42% of the Earth-sized planets that formed fell into the habitable zone around Alpha Centauri B. Therefore, if there are planets there, they might be very interesting to study (and much closer than many of the other stellar systems with planets). There are also reasons that planets in a binary or triple star system would be less likely to exist (e.g., gravitational disruptions could prevent them from accreting), but it seems like a good place to look.

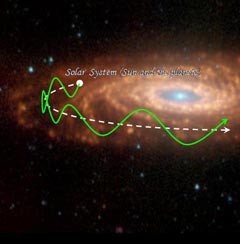
But maybe our own location isn’t always so habitable, either. It’s been observed that if you plot the number of extant species as a function of time on Earth (a biodiversity curve), there is a certain cyclicity to the peaks and troughs. Fourier analysis identifies frequencies that have a strong correlation with the signal. It was previously thought that there was a 26-27 Myr periodicity, but this is now viewed as an artifact of the sampling rate (through time) of the curve. After the recent revision of the geological time scale, a stronger signal is found with a period of 62 Myr. So, what might be happening to cause biodiversity to peak and fall every 62 Myr? There are a lot of ideas, including the Nemesis theory of a companion star repeatedly passing through and disrupting the solar system, a sharp increase in the number of mantle plumes in the Earth, solar nuclear oscillations, and, intriguingly, oscillations in the position of the solar system with respect to the galactic plane. We seem to rise up (“north”) of the galactic plane and dip down (“south”) with a period of about 64 Myr, which could be a potential match. When we head north, we move in “front” of the galaxy as it travels through the intergalactic medium, exposing us to more of the incoming cosmic rays, which are known to have negative effects on life. Three of the five known mass extinctions in history coincide with a peak of this vertical oscillation (one is already quite firmly believed to have been caused by a meteor impact and therefore need not fit with the cosmic ray periodicity). A less exotic explanation for the cyclicity is that sea level changes have affected how well fossils are preserved, therefore making it appear that there are fewer of them when preservation rates are low. In fact, strontium isotope ratios, which indicate the degree of rock weathering and erosion going on, seem to have a strong 59 My periodicity. I’d say that the jury’s still out on this one.

« Newer entries · Older entries »